Inflation has been at an all-time high worldwide. However, in this article, we will focus on inflation statistics from 2000 to 2022 for the United States.
Since the Federal Reserve and Bureau of Labor Statistics have released official data, let’s look at what people in the market are assuming.
Inflation Rate Statistics in the US
Inflation is the economic science factor that describes the level at which the prices of commodities rise. When a country faces a price surge for its goods and services, it consequently means that the currency is getting devalued and losing its purchasing power. Therefore, inflation is commonly denoted by the percentage rate of price changes from a yearly or monthly period, accumulating to showcase inflation rate statistics.
What Is Current Inflation Rate –Values from Historical Years
2022 has been unlike another year of the past decade. With the significant economic impact experienced by the three economic giants of the world, namely, China, the USA and the European powerhouses, global economics is rummaging through a severe downturn. Currently, the inflation rate in the US has gone down from 8.6% in July 2022 to a 7.7% as of October 2022. In fact, according to the Federal Reserve System and statistics released by The Bureau of Labor Statistics (BLS), the combination of the increased oil production prices, gas prices, and the effects of the COVID-19 pandemic that we are still fighting – is highly unlikely that inflation will end anytime soon or at all in 2022.
According to the official data released by the International Monetary Fund, the CPI for the US went from 260 in 2020 to expected to rise to 300 by 2026 – for those who don’t know, historically, that is the highest CPI hike since the base period of 1982 – 1984. Even then, the US inflation rate is still low compared to other countries worldwide.
Product Price Index (PPI) Changes Monthly For 2020/21
(Table of Commodities: Food, Energy, Energy Services, Medical Care, Shelter, Transportation Services, New Vehicle, Appeal)
As shown in the table, back in 2020, after the COVID-19 pandemic was at its peak and the world was trying to settle down, the product price index succumbed to an all-time low and was reached for negatives. Only by the end of the year and with the New Year shining bright on the horizon with new opportunities to recover from the global pandemic did the PPI start to look up again. However, it was still headed for an immediate downfall in June, given the Russia and Ukraine issues. Fortunately, it picked up again the next month.
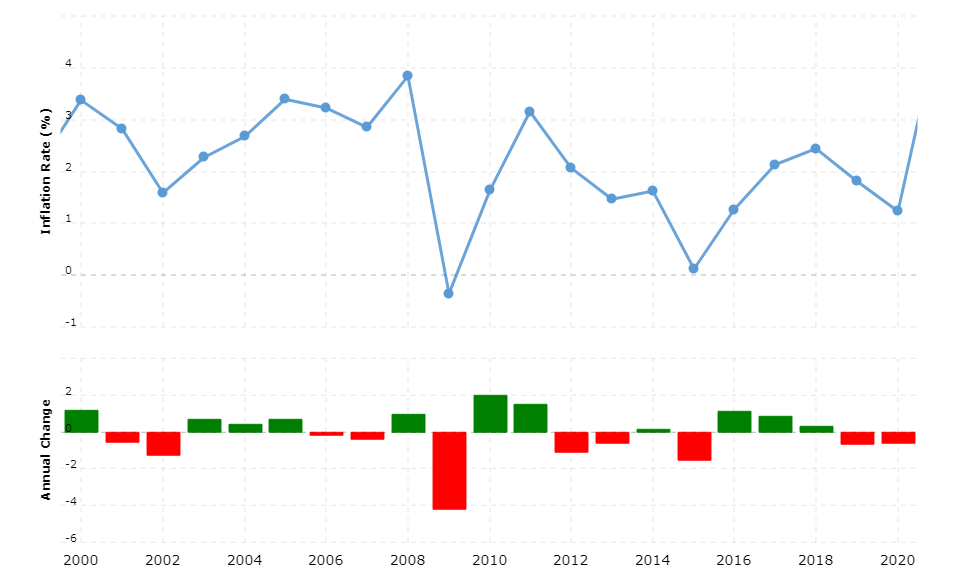
US Inflation Rate Yearly 2000-2022
Year
Inflation Rate (%)
Annual Change
2021
4.70%
3.46%
2020
1.23%
-0.58%
2019
1.81%
-0.63%
2018
2.44%
0.31%
2017
2.13%
0.87%
2016
1.26%
1.14%
2015
0.12%
-1.50%
2014
1.62%
0.16%
2013
1.46%
-0.60%
2012
2.07%
-1.09%
2011
3.16%
1.52%
2010
1.64%
2.00%
2009
-0.36%
-4.19%
2008
3.84%
0.99%
2007
2.85%
-0.37%
2006
3.23%
-0.17%
2005
3.39%
0.72%
2004
2.68%
0.41%
2003
2.27%
0.68%
2002
1.59%
-1.24%
2001
2.83%
-0.55%
2000
3.38%
1.19%
How to Calculate Inflation?
In order to calculate inflation as the Consumer Price Index or CPI, the authoritarian agency in place collects the price data based on thousands of different items, categorized according to the expense class they fall in and broader 10+1 groups. Next, each quarter the price changes of the goods and services under observation are aggregated to result in the CPI inflation basket percentage.
Business Cycle: Expansion and Peak
A business cycle is an economic fluctuation experienced in a nation’s economic activity. As it is a time-based cycle, it has expansions that occur at about the same time as general contractions and are followed by the inevitable recession. It might be a recurrent change of events, but it can’t be periodically assumed to go on unchanged.
What Is CPI and How to Calculate
CPI is short for the Consumer Price Index, which is the average change in the price of commodities over a time period, that is, therefore, paid by the consumers to avail of the goods and services. Basically, it is the measurement of the retained consumer prices, and so it is calculated by dividing the cost of the general category of a product industry by the base year.
How Does The Government Get Price Data For The CPI?
The BLS, or the Bureau of Labor Statistics, collects the price data to calculate CPI by conducting two monthly surveys. The first survey is conducted to record the prices of major goods and services by consulting, visits, online or in-person research methodologies, etc. The other survey is conducted as “the housing survey.” As the name suggests, it helps BLS gain data for over 50,000 property owners and homes via in-person visits or calls.
Personal Consumption Expenditures (PCE)
Personal Consumption Expenditure (PCE), also known as “consumer spending,” is basically the value of the commodity that United States residents have purchased. It also comprises the value of goods and services that might be purchased on behalf of US residents. Hence, the Bureau of Economic Spending BEA is responsible for issuing monthly, quarterly, and annual estimates of the PCE or consumer spending percentage.
Correspondence of CPI and GDP
It is easy to confuse CPI and GDP, and although they may seem a lot similar, there is an obvious differentiation between them. So to put it simply, where CPI is the measurement for the commodity price changes purchased by the consumers, GDP, on the flip side, is a price measurement for goods and services that are purchased by everyone, including regular consumers as well as businesses, government, and foreigners (except for importers).
How Are the Tax Brackets Adjusted For Inflation?
Depending on the changes experienced through the Consumer Price Index, the federal income tax brackets and other federal tax parameters are adjusted accordingly. Inflation is a faltering time for a nation and working through the taxing timeline of a country during such times requires authoritative skill and access to particular data.
Bottom Line
Understanding how inflation has worked its way up to the staggering heights it has reached now would not have been easy had it not been for the inflation statistics distributed by the US government. No matter how much data you accumulate or research you conduct on an individual or third-party level, official data input will always precede the assumptions.
What is the average rate of inflation over the last 20 years?
The average annual US inflation rate for the observation period of 1960 to 2021 has been 3.8% per year.
What is the highest inflation rate in US history?
The all-time high that the US inflation rate has gone as recorded was 23.70% in June of the year 1920.
Why is US inflation so high?
While it is a perfectly understandable question to ask, assuming that the inflation rate in the US is high, it still isn’t as high as some of the other countries around the world as clearly indicated in the inflation statistics. Therefore, the current hike in inflation is worldwide as the world tries to recover the economy from the shambles of the unprecedented pandemic.
Policy Advice is a website devoted to helping everyday people
make, save, and grow money. While our team is comprised of personal finance pros with various areas of expertise, nothing can replace professional financial, tax, or
legal advice.
Policy Advice is a participant in the Amazon Services LLC Associates Program, an affiliate advertising
program designed to provide a means for sites to earn advertising fees by advertising and linking to Amazon.com.Policy Advice
is a participant in the Amazon Services LLC Associates Program, an affiliate advertising program
designed to provide a means for sites to earn advertising fees by advertising and linking to Amazon.com